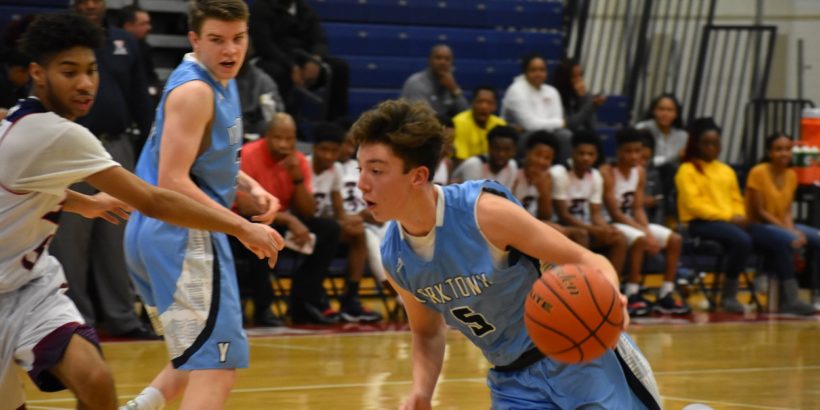
You hear it all the time, coaches bemoaning how young and inexperienced their squad is. We decided to find out how the NOVA squads stacked up, so we took each roster and came up with a number. The number is the average of the entire roster’s class composition. We assigned one point for a freshman, two for a sophomore, three for a junior and four for a senior. A couple of private schools even had an eighth grader or two on the roster–we averaged those as zeroes.
What should you read into this? Well, obviously class isn’t the same as basketball experience. And, we’re doing the whole roster, not just a team’s rotation players. Some teams might have a lot of seniors that nonetheless have limited court experience. Some teams might have a lot of freshmen, but not in the team’s top seven to eight players. So keep that in mind.
Still, this list gives a good idea of the teams that had to deal with more youth across the board this year. A good many of these teams can perhaps expect to see improved play next year as their kids get older and more varsity experience. What is striking/scary is how there are several teams that already performed quite well that are relatively young.
So, the list. Most “experienced” squads on top. There are 3-4 schools not listed, as we couldn’t verify a roster for those squads.
1. W.T. Woodson 3.60
2. Langley 3.54
3. South Lakes 3.50
4. Oakton 3.47
5. W. Springfield 3.44
6. Hayfield 3.43
7. Stuart 3.42
7. Loudoun Valley 3.42
9. Madison 3.38
9. Herndon 3.38
11. Patriot 3.36
11. Annandale 3.36
13. George Mason 3.33
13. Forest Park 3.33
13. Osbourn Park 3.33
16. Battlefield 3.31
17. Flint Hill 3.29
18. Freedom SR 3.27
18. Hylton 3.27
18. Wakefield 3.27
18. VA Academy 3.27
22. Lake Braddock 3.24
23. Stonewall 3.23
23. Rock Ridge 3.23
25. T.C. Williams 3.21
25. Gar-Field 3.21
25. Stone Bridge 3.21
28. Woodbridge 3.20
28. Chantilly 3.20
30. Dominion 3.18
30. JPTG 3.18
32. Mount Vernon 3.15
32. Tuscarora 3.15
32. Marshall 3.15
32. Broad Run 3.15
36. Washington-Lee 3.14
36. Lee 3.14
38. Centreville 3.13
39. Manassas Park 3.09
40. Park View 3.08
40. Falls Church 3.08
40. Edison 3.08
40. Westfield 3.08
40. Champe 3.08
45. Potomac Falls 3.06
46. South County 3.00
46. Woodgrove 3.00
46. Riverside 3.00
46. Potomac School 3.00
50. Jefferson 2.94
51. McLean 2.93
52. West Potomac 2.92
52. Brentsville 2.92
52. Robinson 2.92
52. Osbourn 2.92
56. Fairfax 2.85
56. O’Connell 2.85
56. Colgan 2.85
59. Heritage 2.83
60. Episcopal 2.81
61. Loudoun County 2.80
62. Yorktown 2.79
63. SSSA 2.67
63. Briar Woods 2.67
65. Potomac 2.58
66. Paul VI 2.54
67. Christ Chapel 2.47
68. Bishop Ireton 2.19
Not assessed–Freedom-Woodbridge, Seton School

